
Institutional Self Evaluation Report (ISER) - Institutional Set Standards (ISS)
- Standard 1 – Course Completion
- Standard 2 – Degrees and Certificates Awarded
- Standard 3 – Native Hawaiian Degrees and Certificates Awarded
- Standard 4 – Pell Recipient Degrees and Certificates Awarded
- Standard 5 – Transfers to Baccalaureate Institutions
- Standard 6 – IPEDS Student Success Rate
- Standard 7 – Licensure and Certification Examination Success Rate
- Standard 8 – Job Placement Rate
Standard 1 – Course Completion
Definition – Percentage of students receiving a grade of C or better in a course. The number of students in the course is defined as the number at the end of the official add/drop period during the academic year (AY).
Baseline Value – 70%
Aspirational Value – 75%
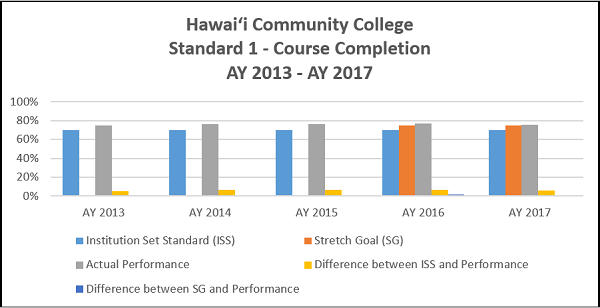
| Category | AY 2017 | AY 2016 | AY 2015 | AY 2014 | AY 2013 | 2013-2017 Average |
|---|---|---|---|---|---|---|
| Baseline Value | 70% | 70% | 70% | 70% | 70% | 70% |
| Aspirational Value | 75% | 75% | -- | -- | -- | 75% |
| Actual Performance | 75.77% | 76.91% | 76.38% | 76.49% | 75.18% | 76.15% |
| Difference between Baseline and Performance | +5.77% | +6.91% | +6.38% | +6.49% | +5.18% | +6.15% |
| Difference between Aspirational Value and Performance | +0.77% | +1.91% | -- | -- | -- | +1.34% |
Standard 2 – Degrees and Certificates Awarded
Definition – Number of Associate Degrees and Certificates of Achievement awarded during the fiscal year (FY).
Baseline Value – Established as the three-year average for FY 2013-2015
Aspirational Value – 5% growth per year from the baseline year
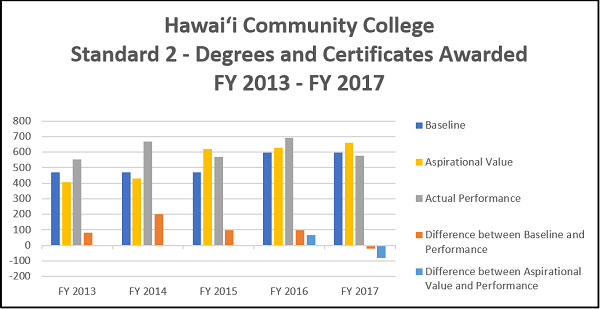
| Category | FY 2017 | FY 2016 | FY 2015 | FY 2014 | FY 2013 | 2013-2017 Average |
|---|---|---|---|---|---|---|
| Baseline | 597 | 597 | 470 | 470 | 470 | 521 |
| Aspirational Value | 658 | 627 | 619 | 429 | 408 | 646 |
| Actual Performance | 576 | 693 | 569 | 669 | 552 | 612 |
| Difference between Baseline and Performance | -21 | 96 | 99 | 199 | 82 | 91 |
| Difference between Aspirational Value and Performance | -82 | 66 | -- | -- | -- | -8 |
Standard 3 – Native Hawaiian Degrees and Certificates Awarded
Definition – Number of Associate Degrees and Certificates of Achievement awarded during the fiscal year (FY) to students of Native Hawaiian Ancestry.
Baseline Value – Established as the three-year average for FY 2013-2015
Aspirational Value – 5% growth per year from the baseline year
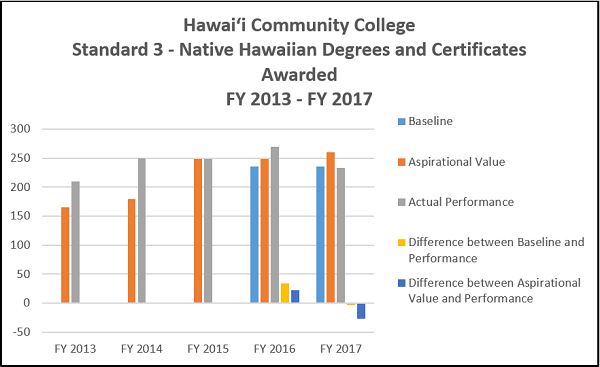
| Category | FY 2017 | FY 2016 | FY 2015 | FY 2014 | FY 2013 | 2013-2017 Average |
|---|---|---|---|---|---|---|
| Baseline | 236 | 236 | -- | -- | -- | 236 |
| Aspirational Value | 260 | 248 | 249 | 179 | 165 | 254 |
| Actual Performance | 233 | 270 | 248 | 250 | 210 | 242 |
| Difference between Baseline and Performance | -3 | 34 | -- | -- | -- | 15 |
| Difference between Aspirational Value and Performance | -27 | 22 | -- | -- | -- | -3 |
Standard 4 – Pell Recipient Degrees and Certificates Awarded
Definition – Number of Associate Degrees and Certificates of Achievement awarded during the fiscal year (FY) to students who ever received Pell awards.
Baseline Value – Established as the three-year average for FY 2013-2015
Aspirational Value – 5% growth per year from the baseline year
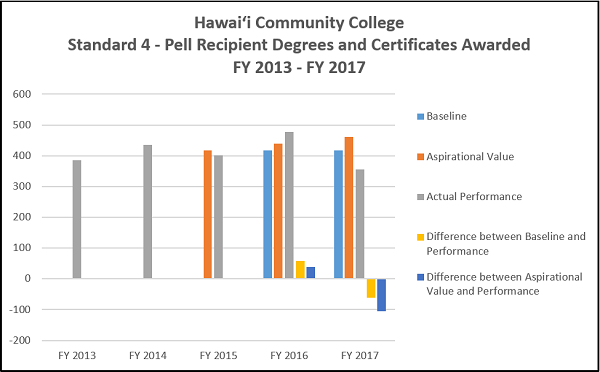
| Category | FY 2017 | FY 2016 | FY 2015 | FY 2014 | FY 2013 | 2013-2017 Average |
|---|---|---|---|---|---|---|
| Baseline | 418 | 418 | -- | -- | -- | 418 |
| Aspirational Value | 461 | 439 | 418 | recipients only tracked | recipients only tracked | 450 |
| Actual Performance | 356 | 477 | 401 | 435 | 386 | 411 |
| Difference between Baseline and Performance | -62 | 59 | -- | -- | -- | -2 |
| Difference between Aspirational Value and Performance | -105 | 38 | -- | -- | -- | -34 |
Standard 5 – Transfers to Baccalaureate Institutions
Definition – Number of Hawai'i CC home based students who transfer to a baccalaureate institution during the academic year (AY).
Baseline Value – Established as the three-year average for AY 2012-2015
Aspirational Value – 5% growth per year from the baseline year
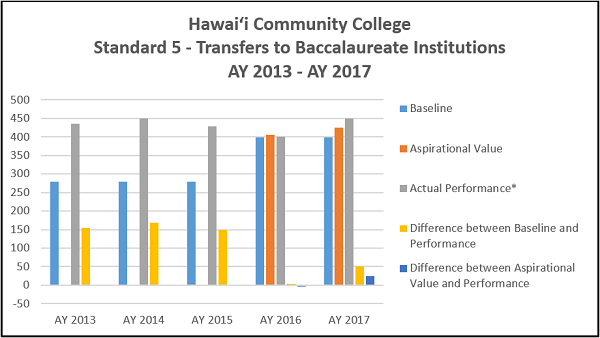
| Category | AY 2017 | AY 2016 | AY 2015 | AY 2014 | AY 2013 | 2013-2017 Average |
|---|---|---|---|---|---|---|
| Baseline | 398 | 398 | 280 | 280 | 280 | 372 |
| Aspirational Value | 425 | 405 | -- | -- | -- | 415 |
| Actual Performance* | 449 | 401 | 429 | 449 | 435 | 433 |
| Difference between Baseline and Performance | 51 | 3 | 149 | 169 | 155 | 105 |
| Difference between Aspirational Value and Performance | 24 | -4 | -- | -- | -- | 10 |
*Summer totals not included
Standard 6 – IPEDS Student Success Rate
Definition – Rate at which first time, full time students either graduate or transfer to a baccalaureate institution within 150% of the time of entry.
Baseline Value – Success rate based on the Fall 2012 IPEDS cohort
Aspirational Value – Incremental growth to reach a success rate of 50% by fiscal year (FY) 2021.

| Category | FY 2017 | FY 2016 | FY 2015 | FY 2014 | FY 2013 | 2013-2017 Average |
|---|---|---|---|---|---|---|
| Baseline | 31.6% | 31.6% | 31.6% | 31.6% | 31.6% | 31.6% |
| Aspirational Value | 39.7% | 37.5% | 35.4% | 33.5% | 31.6% | 35.5% |
| Actual Performance | 31.4% | 27.4% | 31.9% | 33.6% | 32.9% | 31.4% |
| Difference between Baseline and Performance | -0.2% | -4.2% | +0.3% | +2.0% | +1.3% | -0.2% |
| Difference between Aspirational Value and Performance | -8.3% | -10.1% | -3.5% | +0.1% | +1.3% | -4.1% |
Standard 7 – Licensure and Certification Examination Success Rate
Definition – Pass rate for students in a Career and Technical Education (CTE) program based on the number of students taking the examination. The rate must be reported for all programs where the licensure or certification examination is required for employment. Other certification examination may be reported on an optional basis.
Baseline Value – Minimum required pass rate to meet accreditation requirements for programs that are accredited or the average national or state pass rate for the examination for programs that are not accredited.
Aspirational Value – 3% improvement per year improvement in the pass rate over the previous 3-year average, up to achievement level of 95%
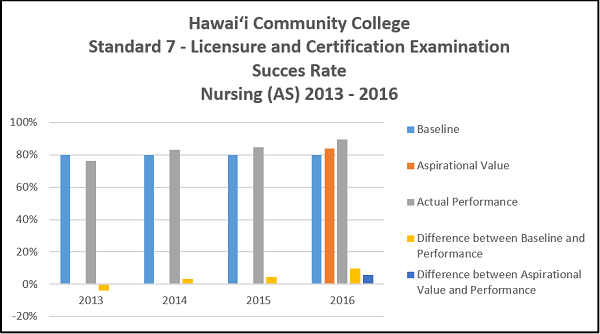
| Program: Nursing AS (National Examination) |
2016 | 2015 | 2014 | 2013 | 2013-2016 Average |
|---|---|---|---|---|---|
| Baseline | 80% | 80% | 80% | 80% | 80% |
| Aspirational Value | 83.81% | -- | -- | -- | 83.81% |
| Actual Performance | 89.59% | 84.62% | 83.33% | 76.19% | 83.43% |
| Difference between Baseline and Performance | 9.59% | 4.62% | 3.33% | -3.81% | 3.43% |
| Difference between Aspirational Value and Performance | 5.78% | -- | -- | -- | 5.78% |
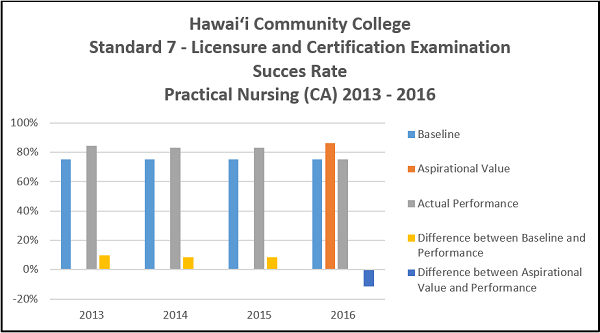
| Program: Practical Nursing (National Examination) |
2016 | 2015 | 2014 | 2013 | 2013-2016 Average |
|---|---|---|---|---|---|
| Baseline | 75% | 75% | 75% | 75% | 75% |
| Aspirational Value | 86.27% | -- | -- | -- | 86.27% |
| Actual Performance | 75% | 83.33% | 83.33% | 84.63% | 81.57% |
| Difference between Baseline and Performance | 0% | 8.33% | 8.33% | 9.63% | 6.57% |
| Difference between Aspirational Value and Performance | -11.27% | -- | -- | -- | -11.27% |
Standard 8 – Job Placement Rate
Definition – Job placement rate reported for each career and technical education program from the Perkins annual report. The Perkins program data includes all graduates and concentrators (students who have completed a subset of program courses) who have left the program. The Perkins target is based on a negotiated level of placement within the State plan for Career and Technical Education that includes an expectation of continuous improvement. Programs with fewer than 10 students exiting the program shall not be reported.
Baseline – Perkins established placement rate for AY 2014
Aspirational Value (AV) – Perkins established improvement rate for each subsequent year.
| Program
|
AY 2017 Pass Rate (%)
|
ISS AV 2017 (%)
|
AY 2016 Pass Rate (%)
|
ISS AV 2016 (%)
|
AY 2015 Pass Rate (%)
|
ISS AV 2015 (%)
|
AY 2014 Pass Rate (%)
|
ISS AV and new baseline value 2014 (%)
|
AY 2013 Pass Rate (%)
|
ISS AV 2013 (%)
|
|---|---|---|---|---|---|---|---|---|---|---|
| Accounting | 53.85 | 64.51 | 52.78 | 63.87 | 64 | 69 | 57.14 | 68.92 | 61.11 | 65 |
| Administration of Justice | 45.45 | 64.51 | 75 | 63.87 | 65.71 | 69 | 31.43 | 68.92 | 59.46 | 65 |
| Agriculture | 42.86 | 64.51 | 50 | 63.87 | 16.67 | 69 | 10 | 68.92 | 11.11 | 65 |
| Architectural, Engineering & CAD Technologies | 43.75 | 64.51 | 50 | 63.87 | 38.89 | 69 | 50 | 68.92 | 25 | 65 |
| Auto Body Repair and Painting
|
71.43 | 64.51 | 50 | 63.87 | 72.73 | 69 | 46.15 | 68.92 | 63.16 | 65 |
| Automotive Mechanics Technology
|
50.00 | 64.51 | 61.9 | 63.87 | 57.89 | 69 | 60 | 68.92 | 61.9 | 65 |
| Business Technology
|
66.67 | 64.51 | 50 | 63.87 | 61.76 | 69 | 40.54 | 68.92 | 57.5 | 65 |
| Carpentry Technology
|
46.15 | 64.51 | 72.73 | 63.87 | 53.33 | 69 | 68.75 | 68.92 | 54.55 | 65 |
| Culinary Arts
|
61.54 | 64.51 | 67.39 | 63.87 | 62.71 | 69 | 51.85 | 68.92 | 65.85 | 65 |
| Diesel Mechanics
|
77.78 | 64.51 | N/A | 63.87 | 69.23 | 69 | 66.67 | 68.92 | 75 | 65 |
| Digital Media Arts
|
50.00 | 64.51 | 66.67 | 63.87 | N/A | 69 | N/A | 68.92 | 20 | 65 |
| Early Childhood Education
|
45.45 | 64.51 | 69.57 | 63.87 | 61.11 | 69 | 44.44 | 68.92 | 62.96 | 65 |
| Electrical Installation and Maintenance Technology
|
68.42 | 64.51 | 76.19 | 63.87 | 88.24 | 69 | 56.52 | 68.92 | 68.42 | 65 |
| Electronics Technology
|
50.00 | 64.51 | 80 | 63.87 | 33.33 | 69 | 60 | 68.92 | 87.5 | 65 |
| Fire Science
|
65.79 | 64.51 | 69.23 | 63.87 | 66.67 | 69 | 64 | 68.92 | 82.86 | 65 |
| Hawai'i Life Styles
|
N/A | 64.51 | N/A | 63.87 | N/A | 69 | 33.33 | 68.92 | 40 | 65 |
| Hospitality and Tourism for
|
47.37 | 64.51 | 56.25 | 63.87 | 50 | 69 | 68.75 | 68.92 | 46.67 | 65 |
| Human Services
|
N/A | 64.51 | 100 | 63.87 | 66.67 | 69 | N/A | 68.92 | 75 | 65 |
| Information Technology
|
50.00 | 64.51 | 37.5 | 63.87 | 56.25 | 69 | 33.33 | 68.92 | 42.86 | 65 |
| Machine, Welding and Industrial Mech Technology
|
50.00 | 64.51 | 58.33 | 63.87 | 57.14 | 69 | 53.85 | 68.92 | 66.67 | 65 |
| Marketing
|
30.77 | 64.51 | 58.33 | 63.87 | 63.64 | 69 | 15.38 | 68.92 | 63.64 | 65 |
| Nursing: AS
|
68.18 | 64.51 | 84.09 | 63.87 | 68.57 | 69 | 48.84 | 68.92 | 55.36 | 65 |
| Nursing: Practical
|
40.00 | 64.51 | 45.45 | 63.87 | 40 | 69 | N/A | 68.92 | 81.82 | 65 |
| Substance Abuse Counseling
|
83.33 | 64.51 | 37.5 | 63.87 | N/A | 69 | 10 | 68.92 | 66.67 | 65 |
| Tropical Forest Ecosystem & Agroforestry Management
|
75.00 | 64.51 | 60.00 | 63.87 | 37.50 | 69 | N/A | 68.92 | 57.14 | 65 |
| Programs Exceeded AV | 8/25 32% |
10/25 40% |
3/25 12% |
0/25 0% |
9/25 36% |
|||||
| Programs ≥ 90% of AV | 1/25 4% |
3/25 12% |
7/25 28% |
4/25 16% |
8/25 32% |
|||||
| Programs < 90% of AV | 14/25 56% |
10/25 40% |
12/25 48% |
17/25 68% |
8/25 32% |
|||||
| N/A = Programs < 10 students exiting the program | 2/25 8% |
2/25 8% |
3/25 12% |
4/25 16% |
0/25 0% |